Scalar Manager Overview
Scalar Manager is a centralized management and monitoring solution for ScalarDB and ScalarDL within Kubernetes cluster environments. It simplifies the operational tasks associated with these products by aggregating essential functionalities into a graphical user interface (GUI).
Why Scalar Manager?
Before Scalar Manager was released, you would need to use various command-line tools and third-party solutions individually to manage and monitor ScalarDB and ScalarDL deployments.
For example, kubectl is often used to check deployment status, the Prometheus stack for monitoring metrics, the Loki stack for log analysis, and Scalar's proprietary CLI tool for pausing Scalar products to ensure transactional consistency between multiple databases.
This constellation of tools presented a steep learning curve and lacked a unified interface, resulting in inefficient workflows for performing routine management tasks or troubleshooting issues.
Scalar Manager mitigates these pain points by aggregating essential functionalities into a single, user-friendly GUI. With Scalar Manager, you can reduce the time and effort needed for management and monitoring, allowing you to focus on business development and operations.
Key features
At its core, Scalar Manager provides the following features.
Centralized cluster visualization
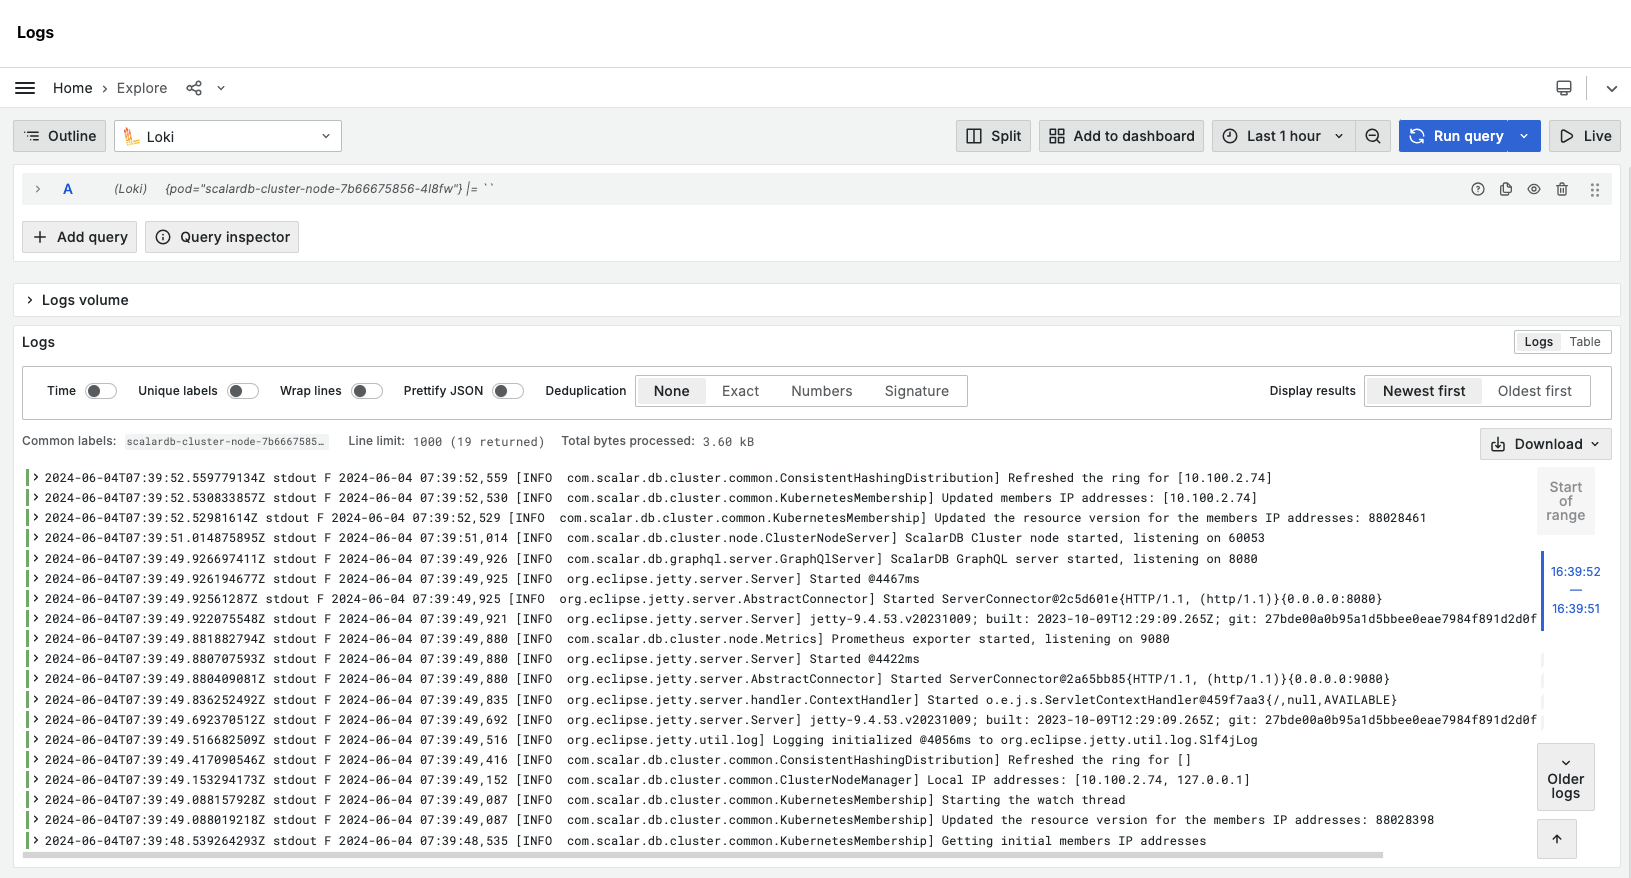
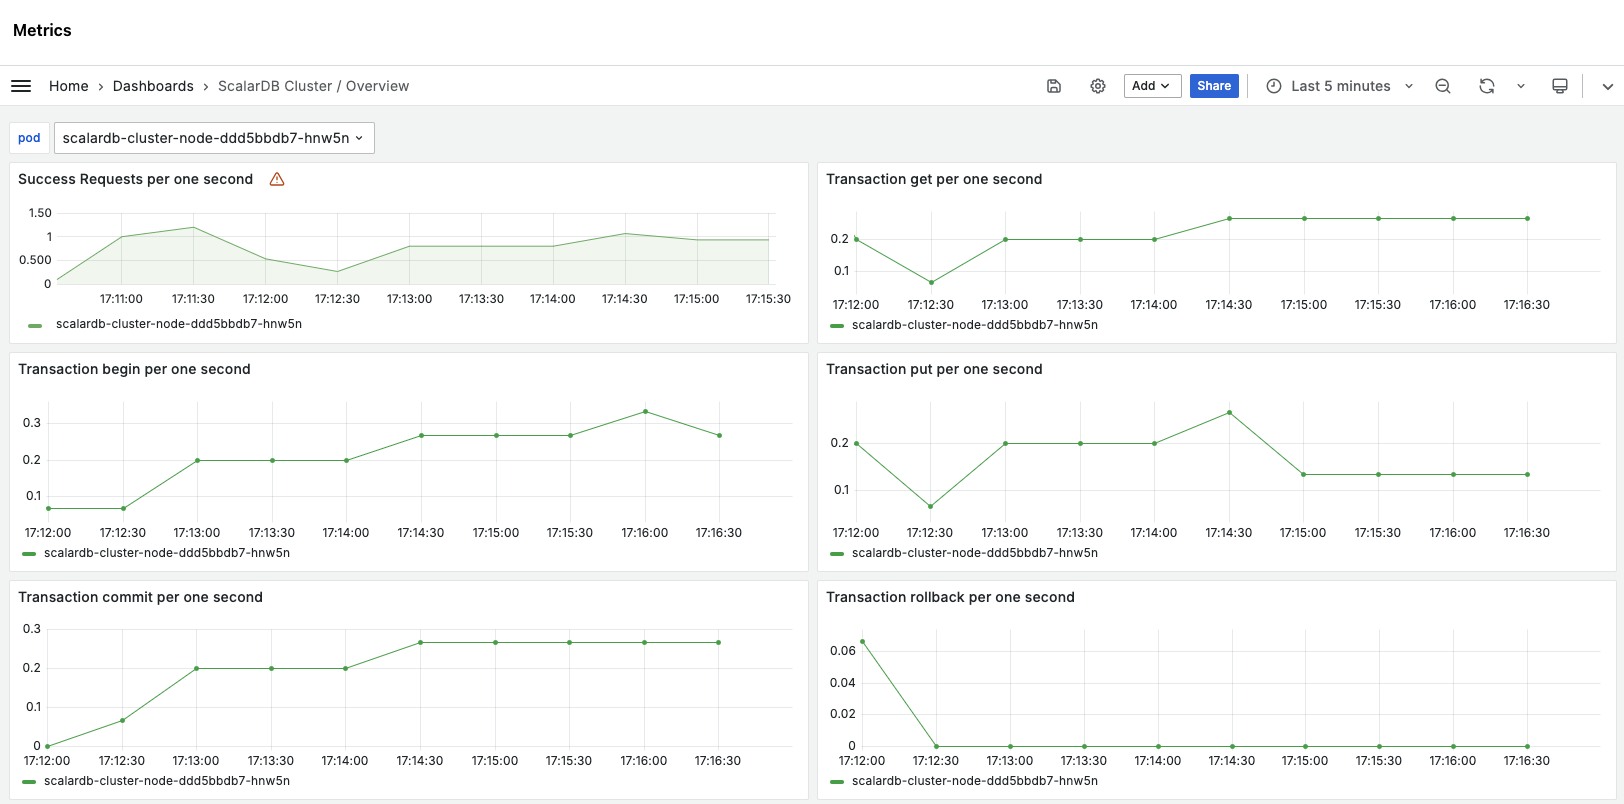
You can quickly gain real-time metrics about cluster health, pod logs, hardware usage, performance metrics like requests per second, and deep visibility into time-series data via integrated Grafana dashboards.
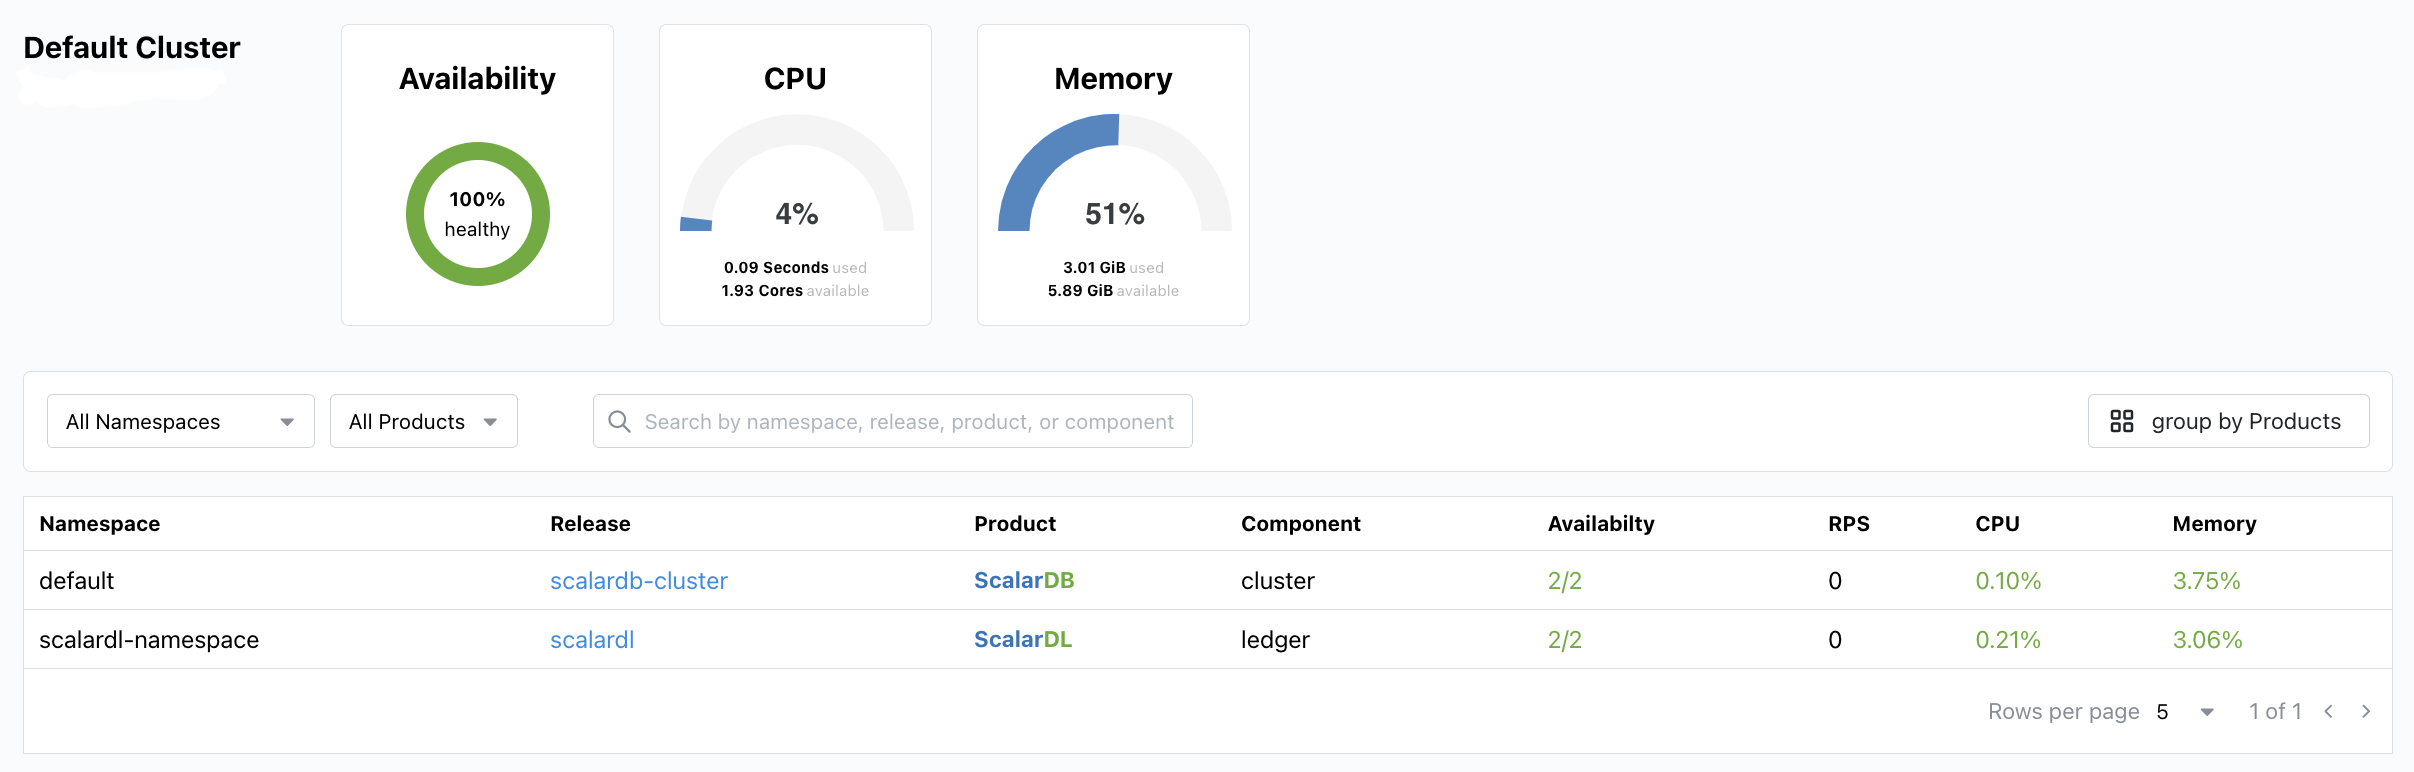
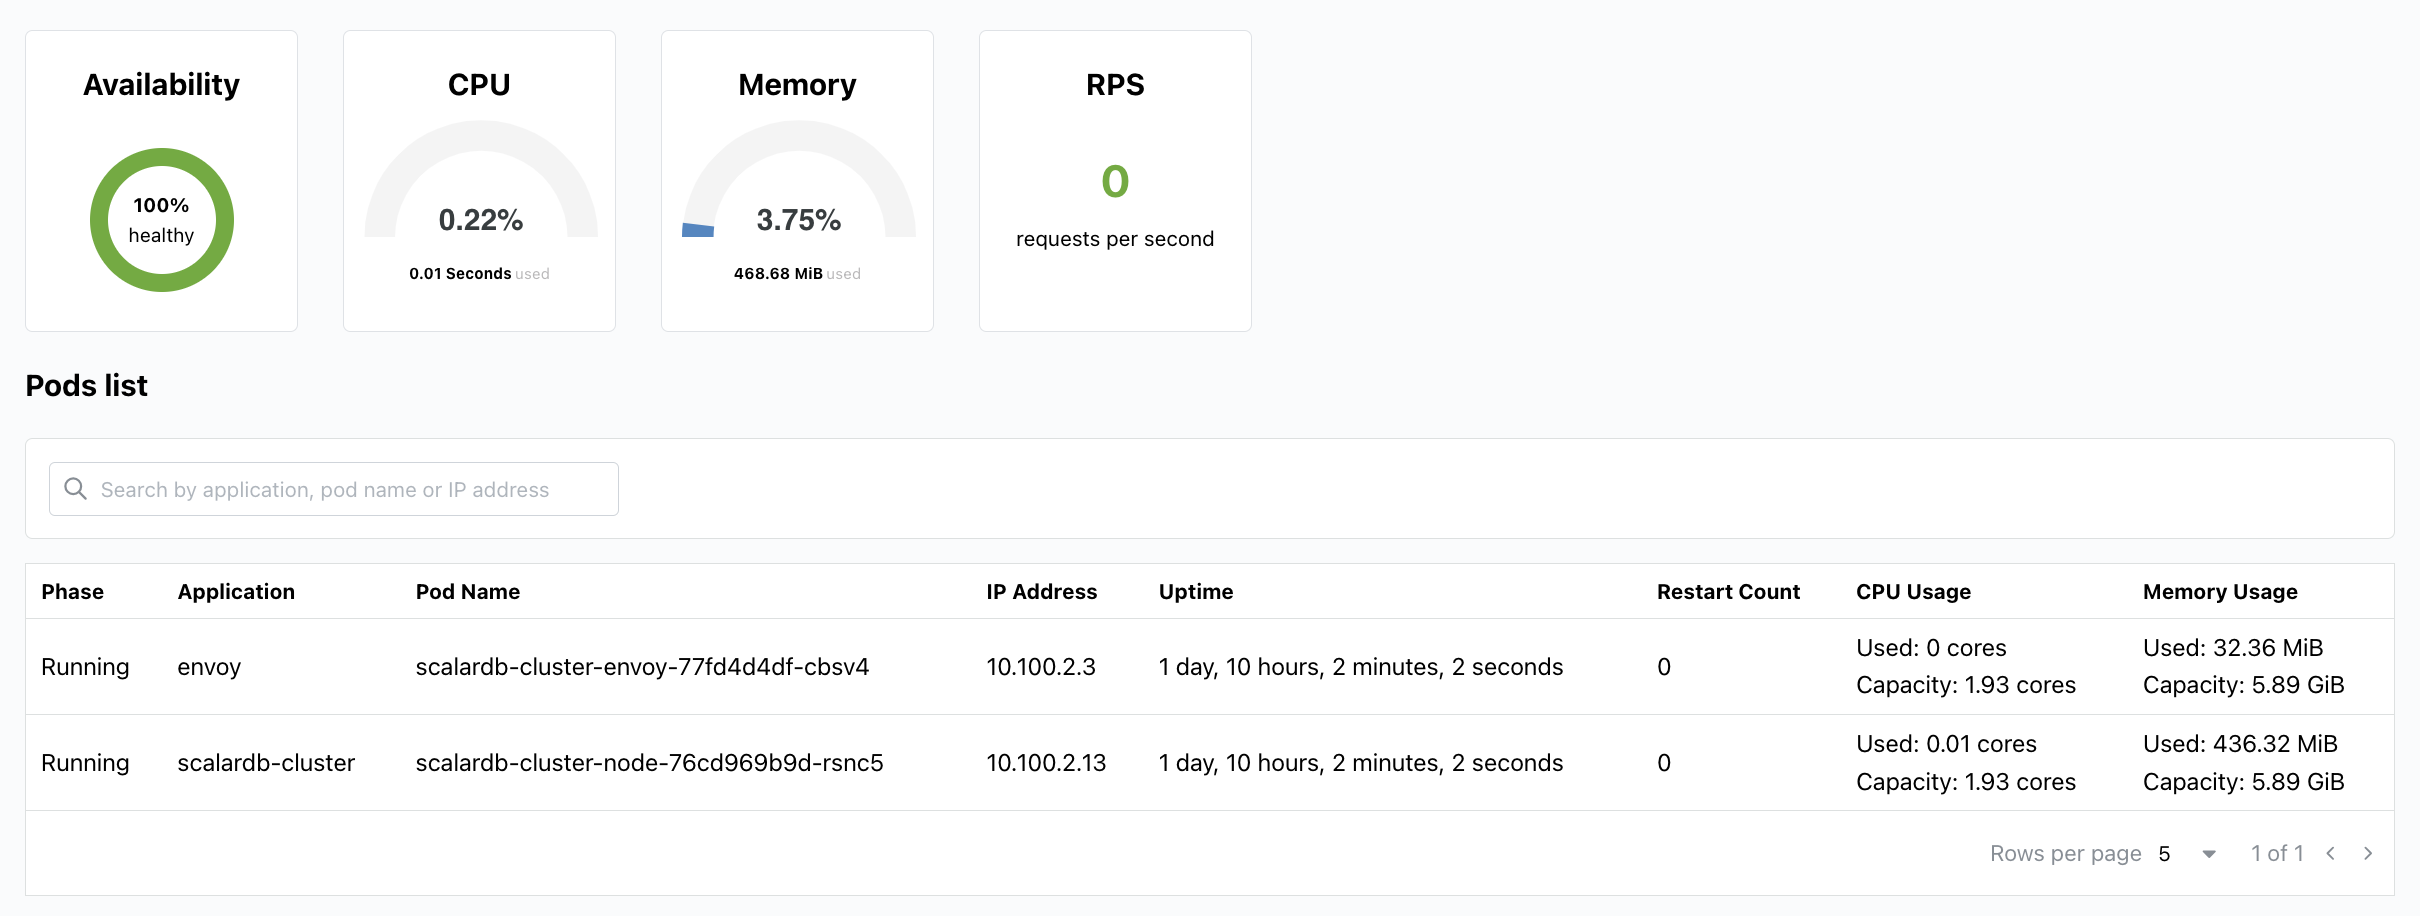
You can view pod logs and metrics in real time or in time series.
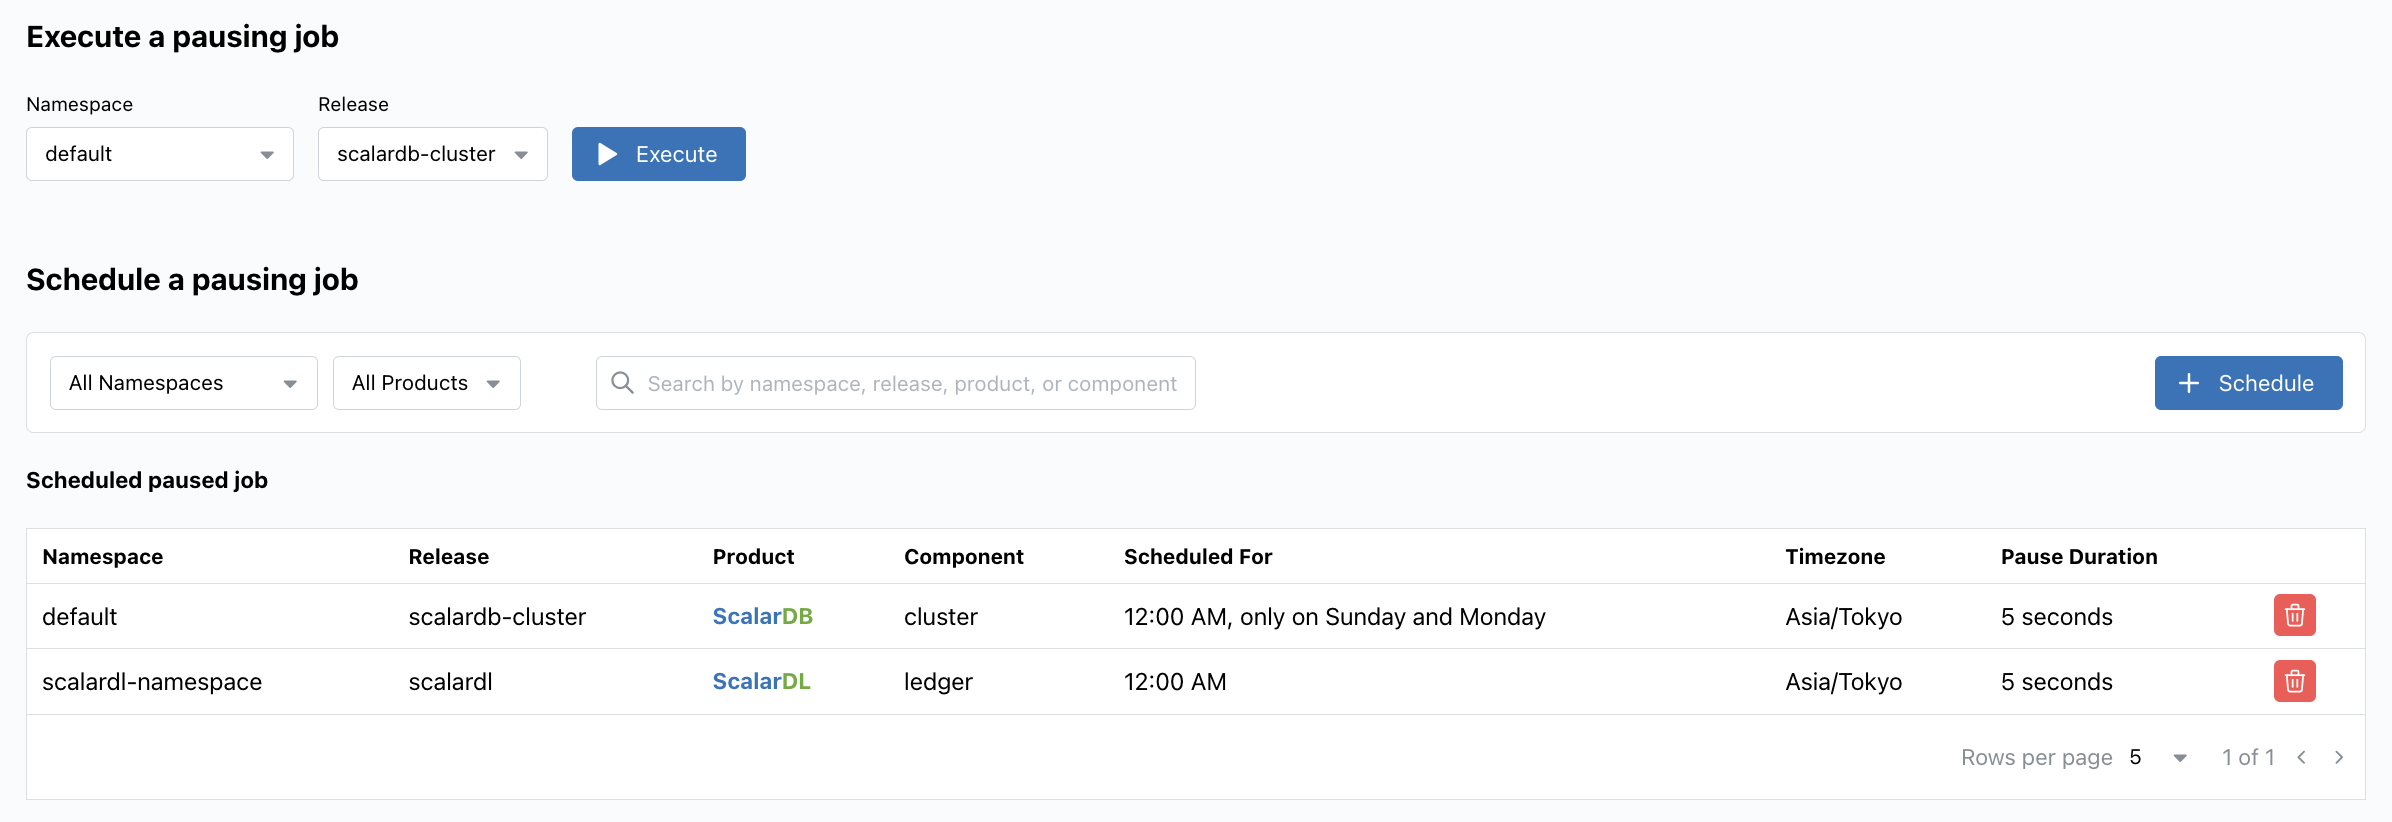
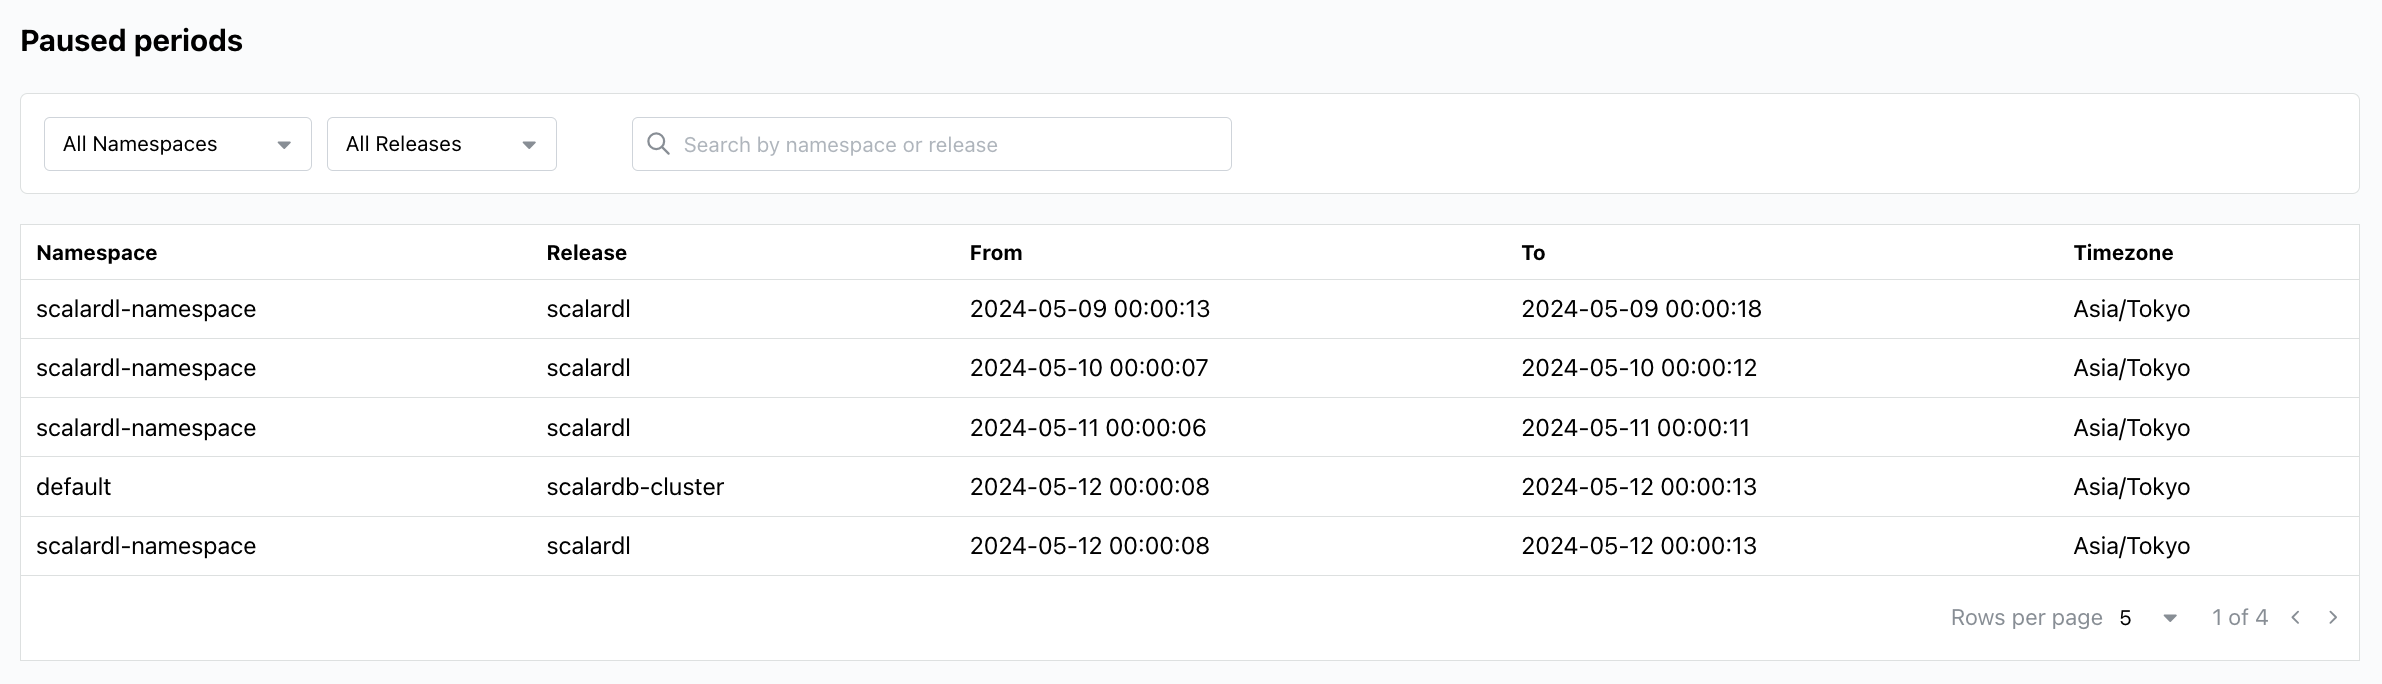
Streamlined pausing job management
You can execute or schedule pausing jobs to ensure transactional consistency, review and manage scheduled jobs, and monitor paused states within an intuitive GUI.
Although you can continue using various tools and solutions to manage or monitor ScalarDB and ScalarDL, Scalar Manager offers a more straightforward approach that enhances operational efficiency and user experience.